APRI member Prof. Leopold Haimberger, University of Vienna, summarizes his Polar Talk #21 about insights how the energy fluxes between the Arctic and its environment can be quantified and which future prospects can be derived from this.
The polar caps can be compared with a fridge – energy is constantly extracted from them due to radiation to space and replenished with heat from lower latitudes. Only a slight imbalance between the fluxes is already sufficient to cause ice melt or freezing. In the past 20 years the global observing system has improved enough to allow for quantification of the energy fluxes to space as well as within the atmosphere and the oceans.
The arctic energy balance
Conservation of energy is a strong constraint for dynamic systems, including the Arctic. If more energy goes into the Arctic system than out, the additional energy is used mostly for heating the ocean and, especially in the polar regions, also for melting ice, both at sea and land. The amount of melted ice per year, more than 500 Gigatonnes in the Arctic, is relatively well known. The melt is caused by a small but persistent imbalance of the energy budget. It is only about 0.7 Watts per square meter (W/m2) in the Arctic on average in the past 20 years but it is increasing over time. Thereof about 0.4 W/m2 go into heating the ocean and about 0.3 W/m2 go into ice melt. The polar imbalance is not larger than in the oceans nearer to the equator, where it goes only into ocean heating (Mayer et al. 2019).
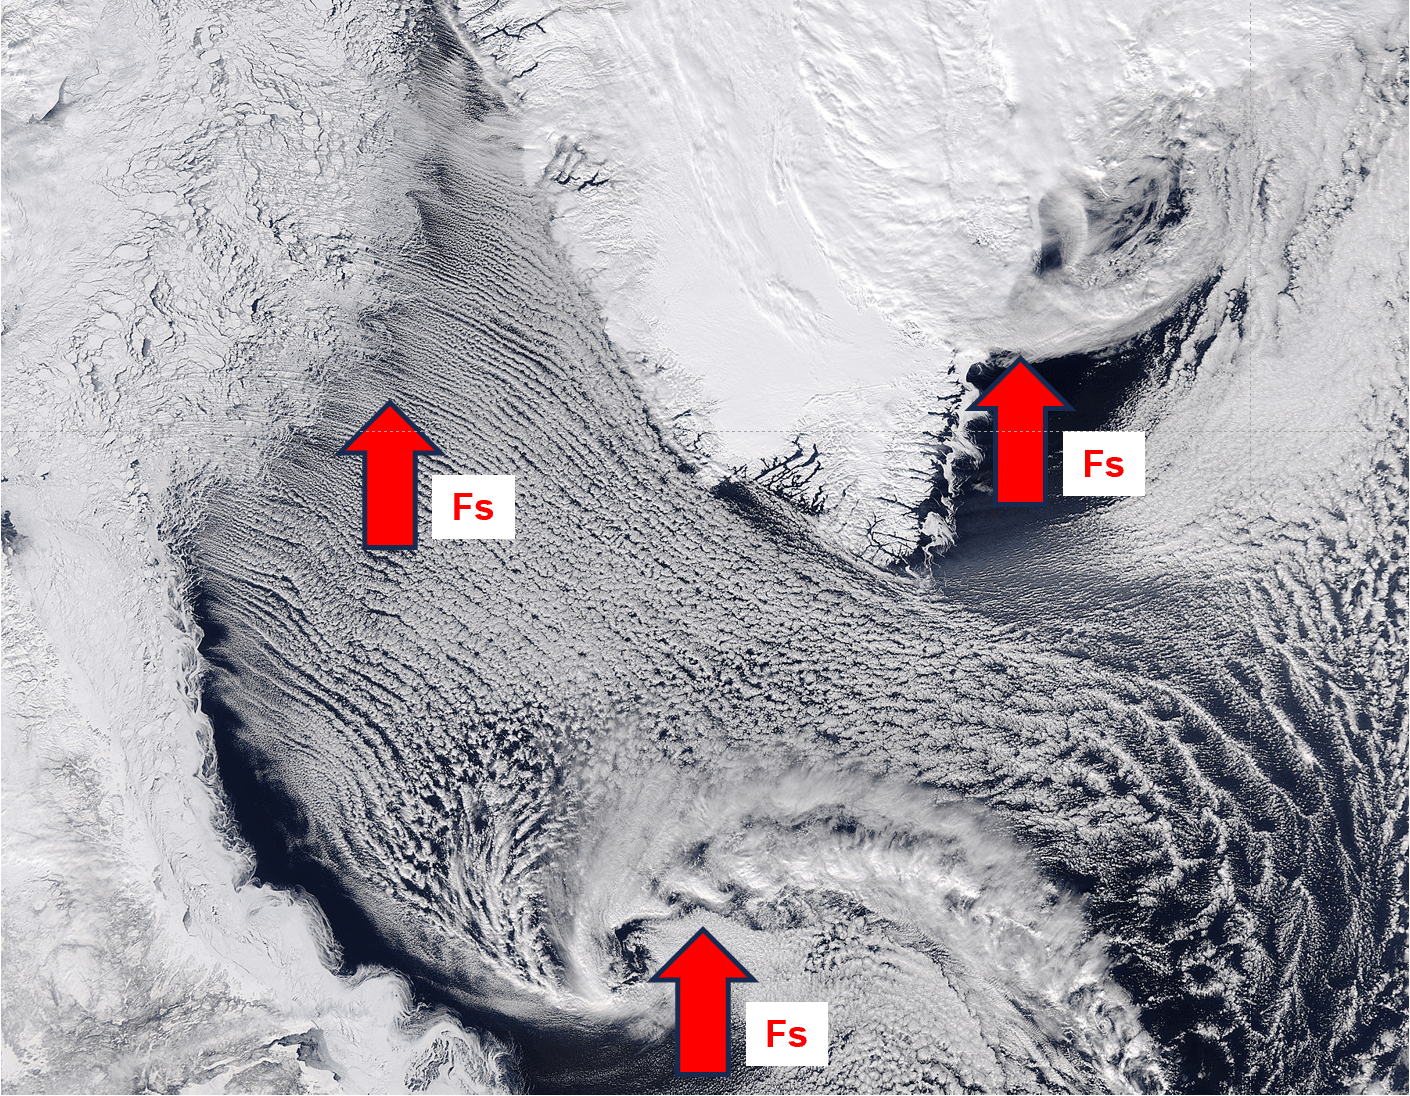
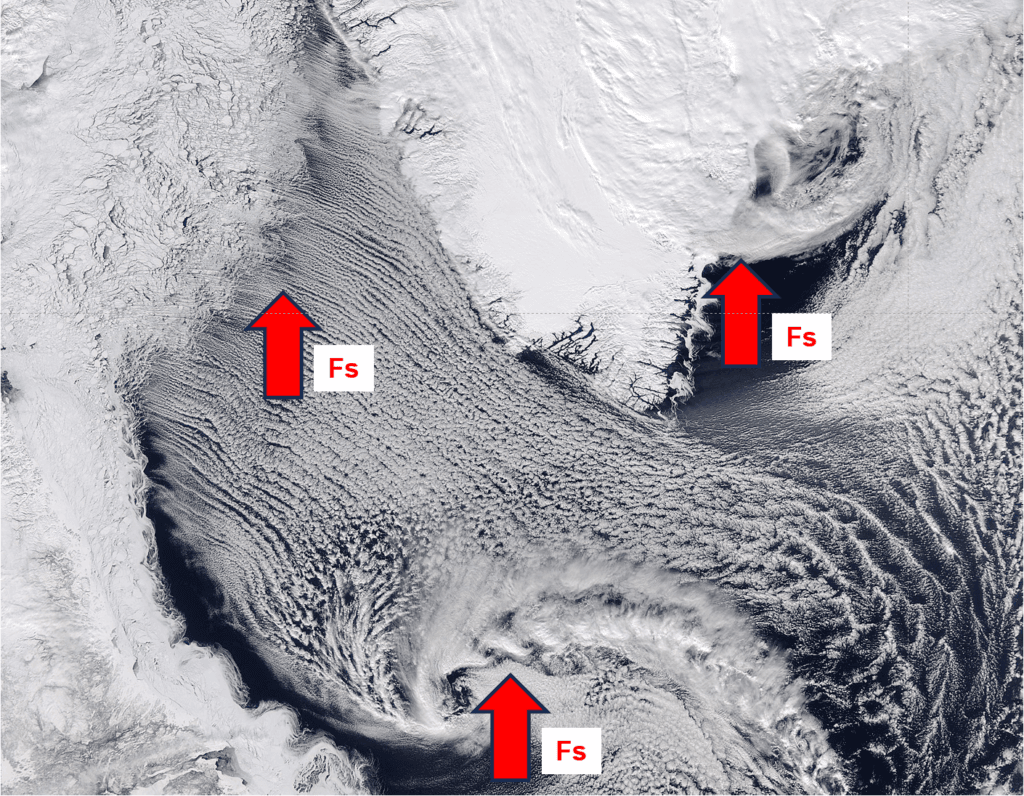
Energy flows in the Arctic (© polarlows)
During cold air outbreaks from snow- or ice-covered areas over Canada (figure above left), the northern Davis strait (upper left) or Greenland (figure center) to the comparatively warm open Atlantic waters, strong surface energy fluxes FS (up to 2000 W/m2, equivalent to one fully turned on electric stove top per square meter) out of the ocean occur over large regions. The strong, moist energy flow from the ocean below destabilizes the atmosphere above and generates spectacular convective cloud streets. In the depicted subpolar cyclone, the cold air is also predominantly transported southward and heated, whereas warm, moistened air is transported northward, leading to a net northward energy flux FA.
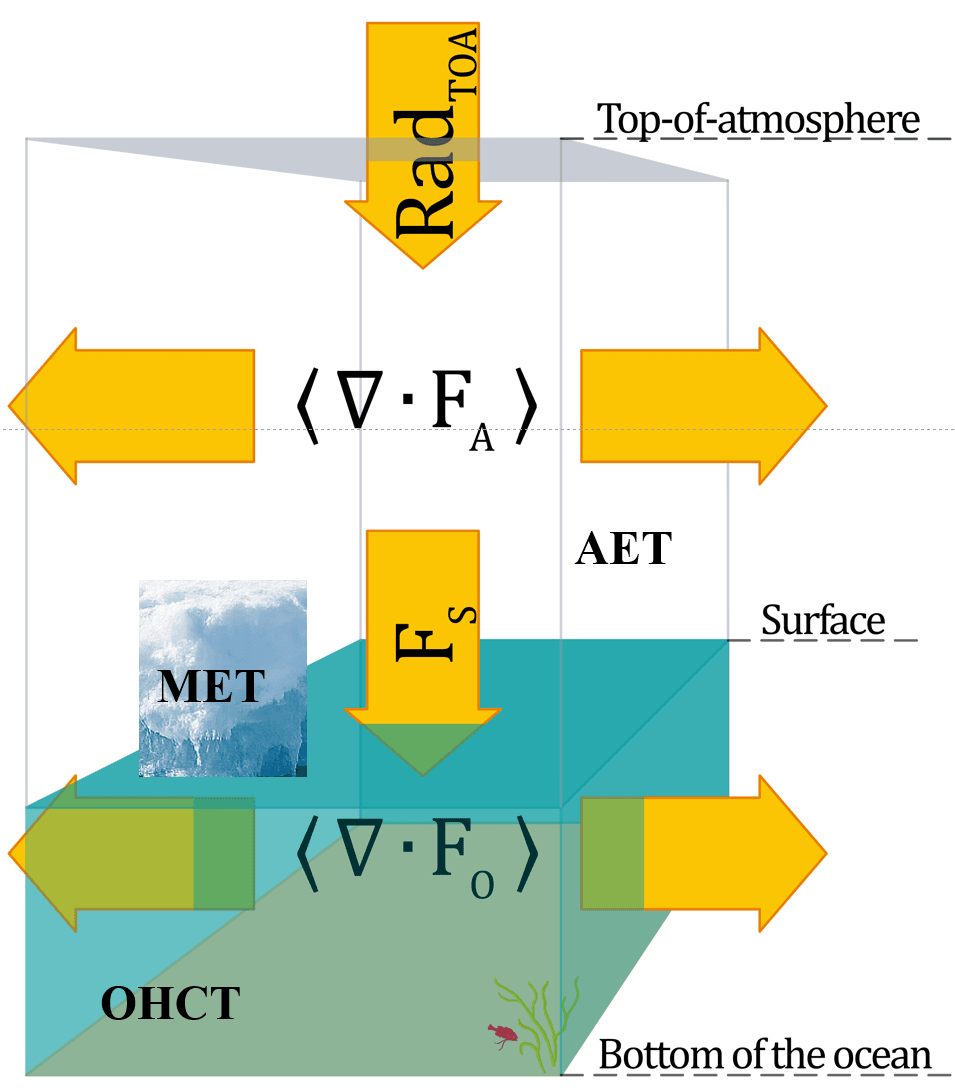
Schematic of the polar energy budget (© Michael Mayer)
The fluxes FA and FS are parts of a coupled budget of atmosphere, ocean and cryosphere in the polar climate system (see figure), which can be written in the annual mean in a simplified form:
RadTOA−AET−∇⋅FA=OHCT+∇⋅FO+MET+R
RadTOA is top of atmosphere radiation, AET is the atmospheric warming rate, ∇⋅FA is the net horizontal outflow of energy from the Arctic (usually negative), OHCT is the oceanic warming rate, ∇⋅FO is the net horizontal outflow of oceanic energy out of the Arctic, MET is the melt rate of ice and R is a residual term that collects unaccounted processes or data errors. The individual fluxes that should balance are several orders of magnitudes larger (e.g. 115 W/m2 outgoing net radiation at the top of the atmosphere) than the melt rate. The net surface energy flux FS from the atmosphere into the ocean (see figure) is very important but cancels out if one sums over atmosphere and ocean.
It is important to quantify all terms of the Arctic energy balance with observation-near data sources such as gridded satellite-based radiation products like CERES as well as so-called climate-reanalyses of the atmosphere and ocean (ERA5 or GREP). The reanalyses map almost all available irregularly occurring observations (such as satellite data, radiosondes, buoys, floating buoys that dive down to 2000m ocean depth) in an optimal way onto a computer model grid. Fluxes calculated from those data can be compared with fluxes from models used for climate projections.
“Quantification of the atmospheric, oceanic and cryospheric components of the arctic energy cycle is key to fully understand Arctic climate change.”
Prof. Leopold Haimberger
The role of the ocean and potential changes in its circulation
For the ocean to stay warm, its energy must be replenished from lower latitudes as well, where it is heated mostly through direct insolation in the subtropics. Thanks to the hugely improved ocean observing system the lateral oceanic transports can now be quantified along arbitrary sections, but particularly at subarctic and arctic water straits (Winkelbauer et al. 2026). Results from those observation-near data products begin to indicate that the northward energy transport due to the Atlantic Meridional Overturning Circulation is slowing down (AMOC, Rahmstorf, 2024)), as predicted by several of the most sophisticated climate models.
The surface energy flux FS, which can be estimated indirectly in the atmosphere as
Fs= RadTOA−AET−∇⋅FA
also shows interesting weakening signals over the subarctic Irminger Sea (south of Greenland) and south of it (see figure below). Such weakening is expected during a weakening of the AMOC and would also be consistent with a reduced deep convection down to the sea floor according to climate model simulations.
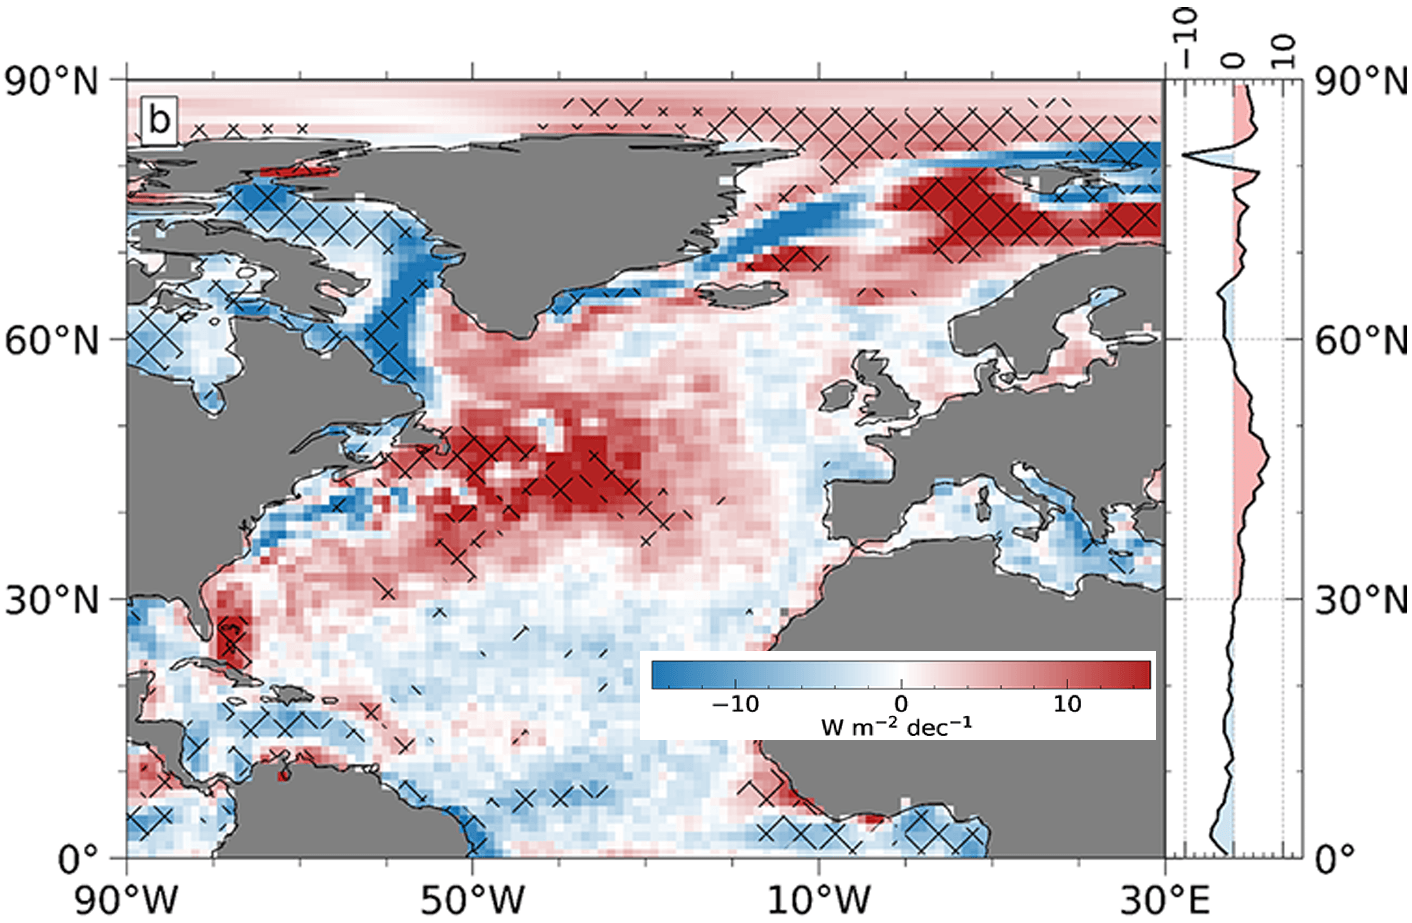
Linear trend of indirectly estimated net surface energy flux Fs over the North Atlantic and adjacent polar oceans during months October-December over the period 1985-2019. From Mayer et al. 2023.
The graphic shows the linear trend of the indirectly estimated net surface energy flux Fs over the North Atlantic and adjacent polar oceans during months October-December over the period 1985-2019. The flux is predominantly negative in Winter (i.e. out of the ocean). If this trend is positive, it therefore means weakening, particularly over the subpolar North Atlantic.
If deep convection would indeed collapse sometime in the second half of this century, as predicted by a relatively large fraction of state-of-the-art climate models, it would lead to significant cooling over South Greenland and Northwestern Europe, potentially stopping the ice melt there for a few decades, despite the overall warming in the global mean.
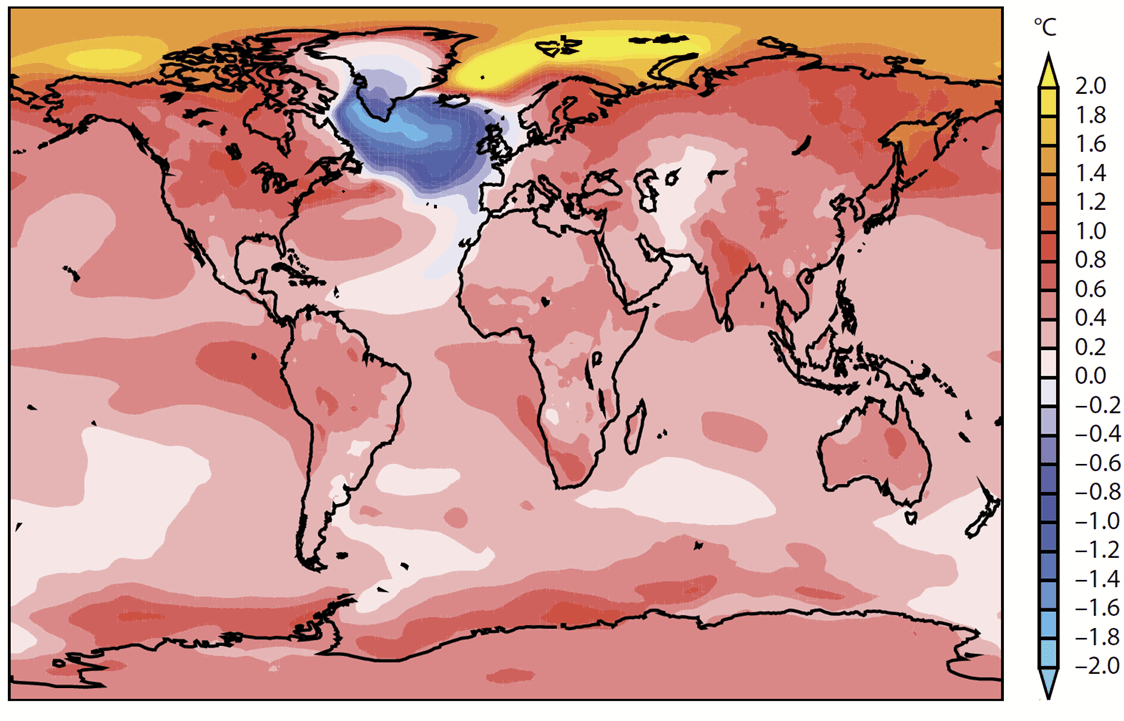
Temperature changes in the model-mean before and after a collapse of convection in the subpolar gyre. From Swingedouw et al. (2021)
The graphic about the expected annual temperature changes (the 20 years after minus the 20 years before) indicates a collapse of the convection in the subpolar gyre region, according to an ensemble of simulations of 3 state of the art climate models.
Outlook
Results indicate that surface energy fluxes from observation-near data are sufficiently accurate to serve as reference for equivalent products from climate model simulations, and, potentially, as an indicator for ongoing circulation changes in the oceans. The calculation of the observation-near energy flux estimates also teaches us a lot about the underlying observing system and its potential deficiencies, which helps improving it in the future. In this respect it is important to keep up established monitoring networks in the atmosphere and the ocean. Especially in the Arctic, we need to strengthen the observing system, through well-coordinated campaigns such as the upcoming International Polar Year 2032/33 (IPY5, https://ipy.info ) to build up momentum for this.
Regarding the ice melt: it appears unstoppable given that the global greenhouse gas emissions do not cease and Earth’s energy imbalance increases further. As a defrosting fridge tends to flood the kitchen, we see an alarming, accelerating sea level rise, more than 10 cm in the past 30 years. This will become a big stressor for future generations.
Media information
Layout by the APRI-Media Team.
Contact: use our contact form.
About the scientific author
See Leopold Haimberger’s CV.
References
AMOC: https://tos.org/oceanography/assets/docs/37-rahmstorf.pdf
ERA5: Hersbach et al. (2020): The ERA5 Global Reanalysis. https://rmets.onlinelibrary.wiley.com/doi/10.1002/qj.3803
Mayer, M., S. Tietsche, L. Haimberger, T. Tsubouchi, J. Mayer, and H. Zuo, 2019: An Improved Estimate of the Coupled Arctic Energy Budget. J. Climate, 32, 7915–7934, https://doi.org/10.1175/JCLI-D-19-0233.1.
Mayer J., Haimberger L. and Mayer, M., 2023: A quantitative assessment of air–sea heat flux trends from ERA5 since 1950 in the North Atlantic basin. Earth Syst. Dynam., 14, 1085–1105, 2023 https://esd.copernicus.org/articles/14/1085/2023/esd-14-1085-2023.pdf
Winkelbauer, S., Winterer, I., Mayer, M., Fu, Y., and Haimberger, L.: Subpolar Atlantic meridional heat transports from OSNAP and ocean reanalyses – a comparison, Ocean Sci., 22, 629–651, https://doi.org/10.5194/os-22-629-2026, 2026.
Swingedouw, D., Bily, A., Esquerdo, C., Borchert, L.F., Sgubin, G., Mignot, J. and Menary, M. (2021), On the risk of abrupt changes in the North Atlantic subpolar gyre in CMIP6 models. Ann. N.Y. Acad. Sci., 1504: 187-201. https://doi.org/10.1111/nyas.14659