

ENVEO IT, a company active in cryosphere research and applications based on Earth observation from space, recently joined APRI. Motivation for the enrolment were the efficient coordination and promotion activities of APRI for polar research of Austrian institutions, enhancing the visibility of research achievements and facilitating the access to international polar projects and scientific committees.
ENVEO’s core activities include the development of methods for deriving products on key environmental parameters from Earth observation satellite data, the continuous generation of such products and the provision of related services for hydrology, water management and climate research. A main application field is the land cryosphere, the portfolio of which includes a range of diverse products on seasonal snow cover, glaciers and ice sheets covering regional to global scales. Here we show examples for some of ENVEO’s products over ice sheets.
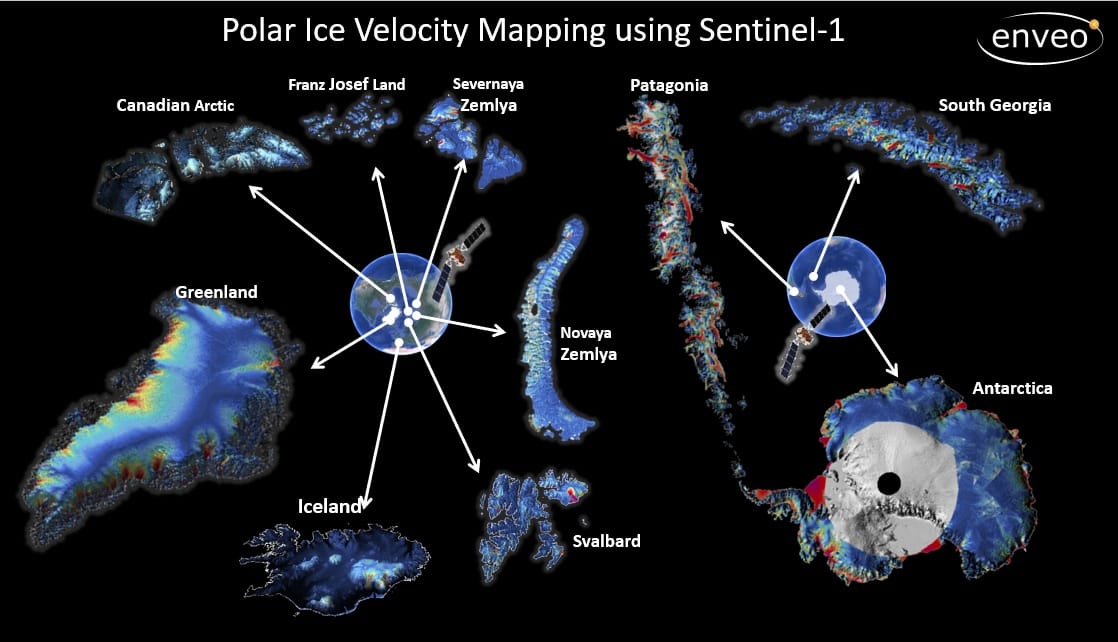
Coverage of polar ice velocity maps generated by ENVEO from data of the Sentinel-1 mission.
Surface Velocity Maps over Antarctica
The Copernicus Sentinel-1 mission, the first satellite of which was launched in 2014, opened up a new phase for the observation of polar ice dynamics, acquiring continuous time series of synthetic aperture radar (SAR) images over ice sheets, ice caps and glaciers. ENVEO has developed specific algorithms for generating spatially detailed maps and dense time series of glacier and ice sheet velocity from SAR data of Sentinel-1. High resolution time series of surface velocity, starting in 2014, have been produced for the large ice sheets, examples of which are shown below.
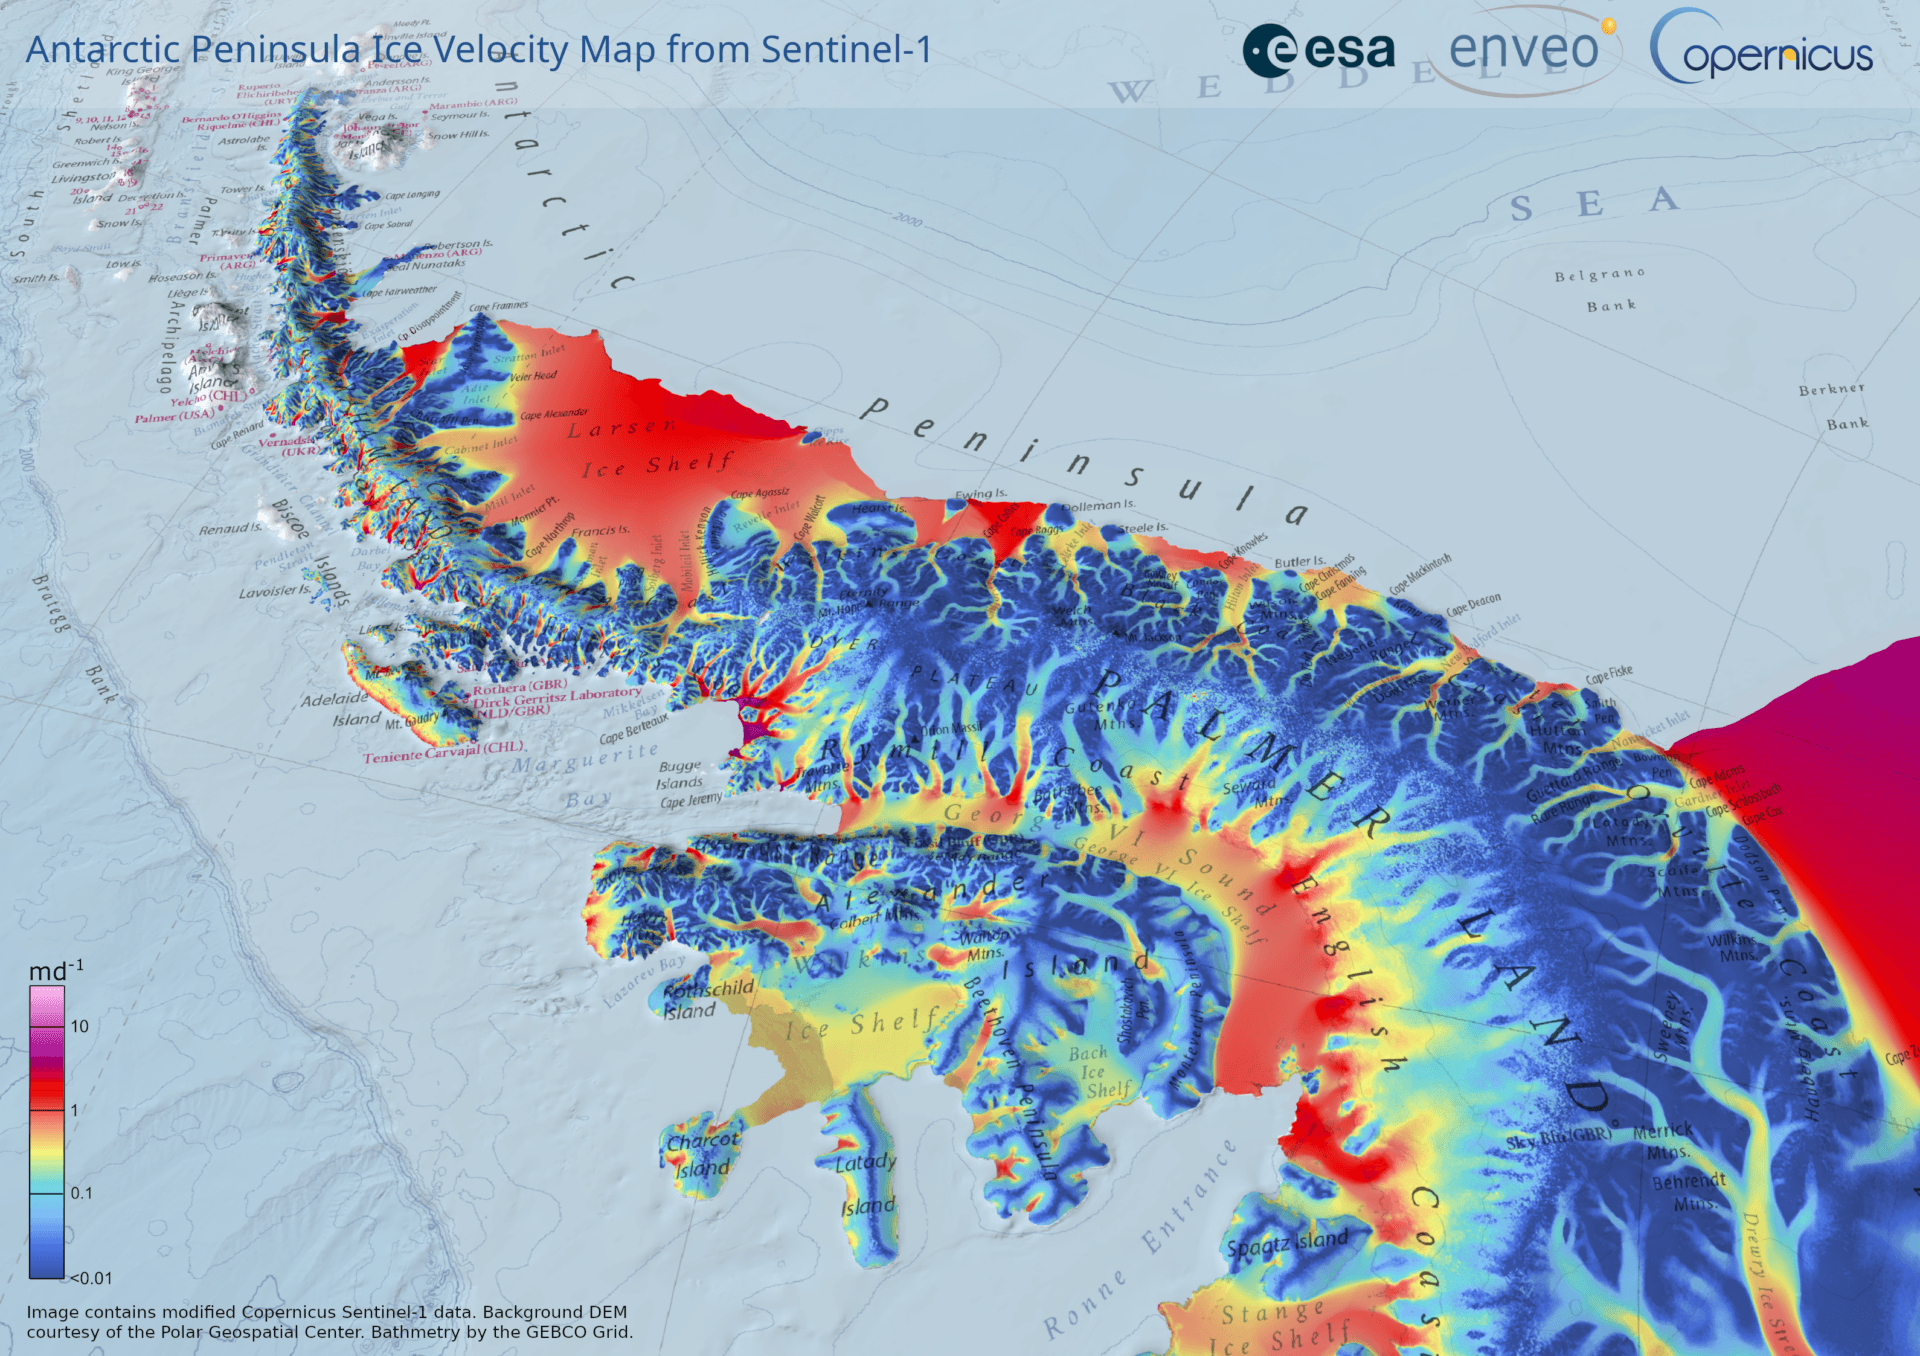
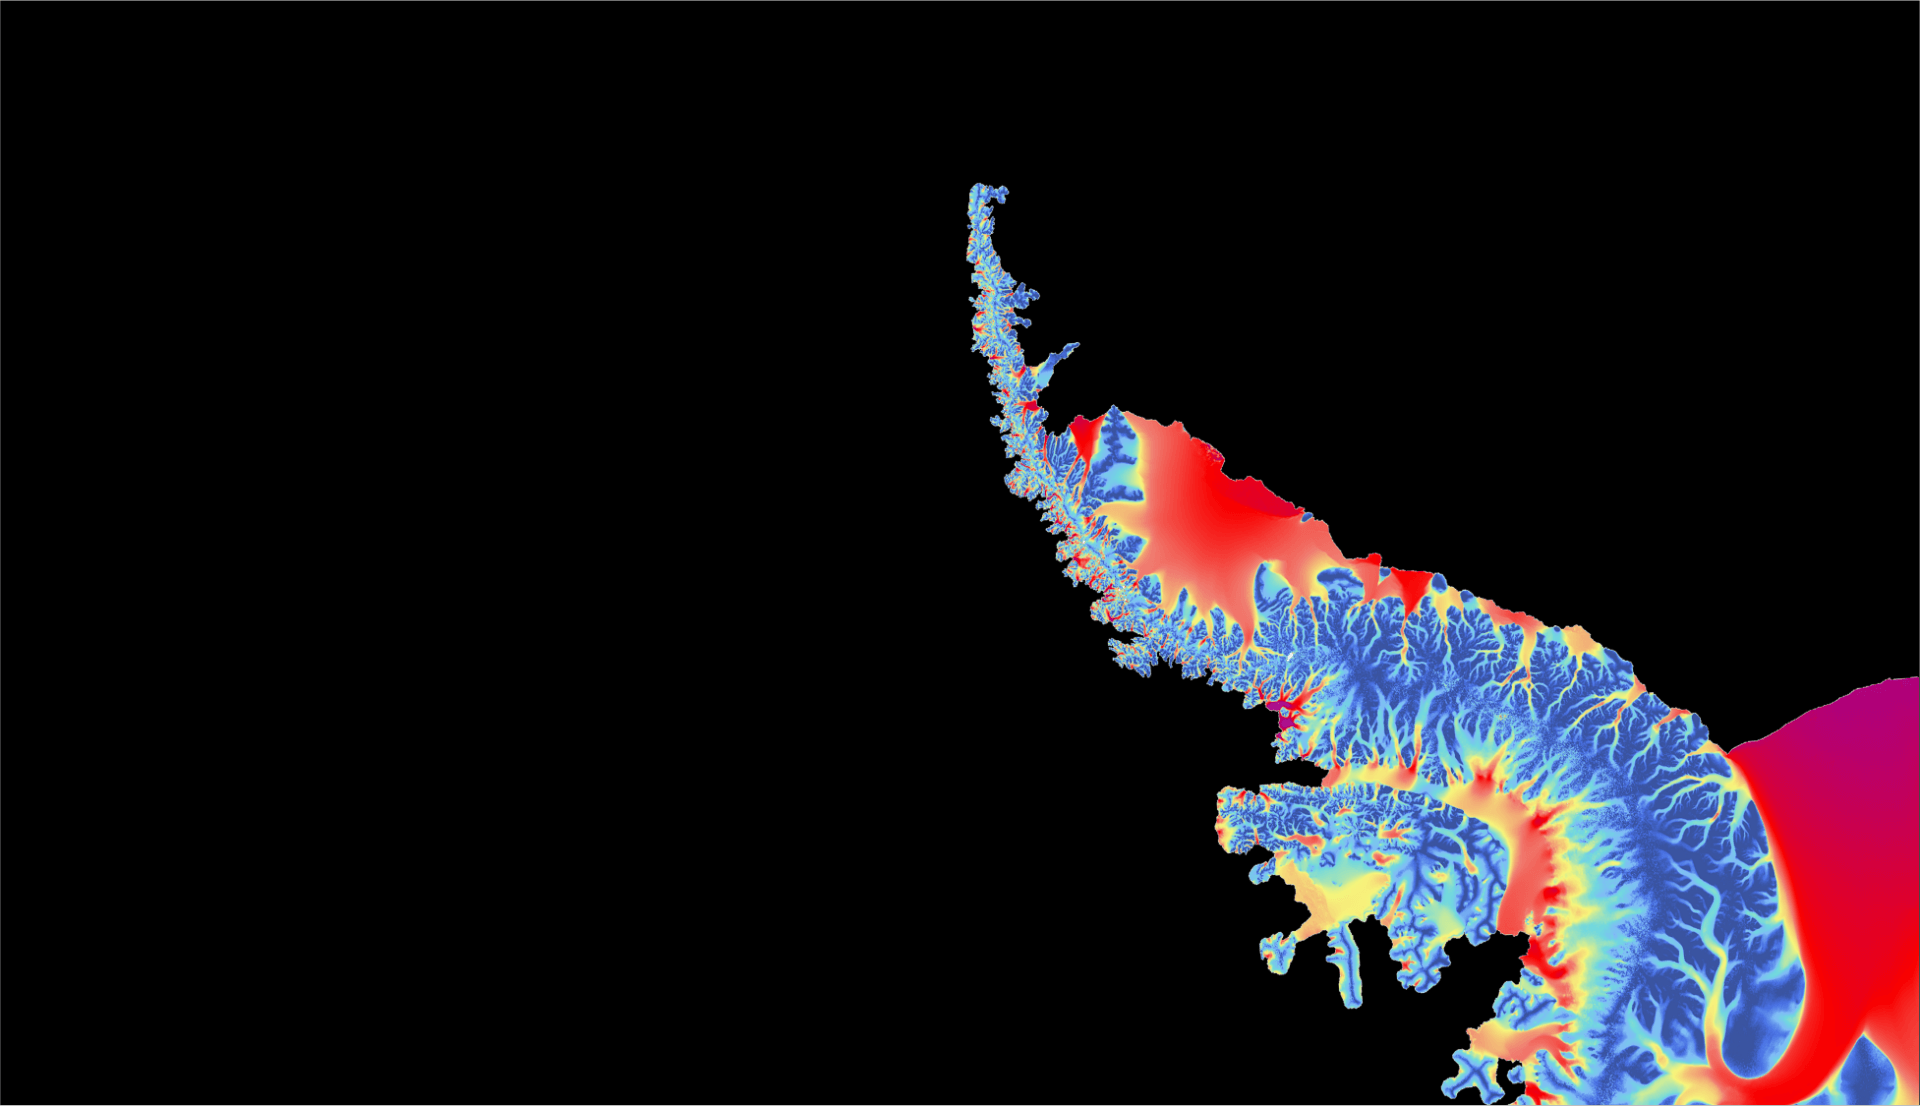
Map of ice velocity (magnitude in m/day) of the Antarctic Peninsula, derived from Sentinel-1 SAR images.
The Antarctic ice velocity maps are based on the offset tracking method applied to SAR intensity images and cover all areas north of 78.7°S. The areas to the south are not covered by Sentinel-1 SAR. The velocity maps are gridded at 200 m in Antarctic Polar Stereographic projection. The density of repeat observations and time intervals for velocity maps varies between different sections of the ice sheet. Highly dynamic zones, including the Antarctic Peninsula, large parts of the West Antarctic Ice Sheet and several sections along the coast of East Antarctica, are imaged continuously in 6 or 12 day intervals. The velocity map below demonstrates the complex pattern of flow features on the Antarctic Peninsula. The image with the velocity time series shows ice flow acceleration of Thwaites Glacier between 2014 and 2025, a typical feature of the large outlet glaciers to the Amundsen Sea of West Antarctica. This causes large losses of ice mass due to increased export of grounded ice.
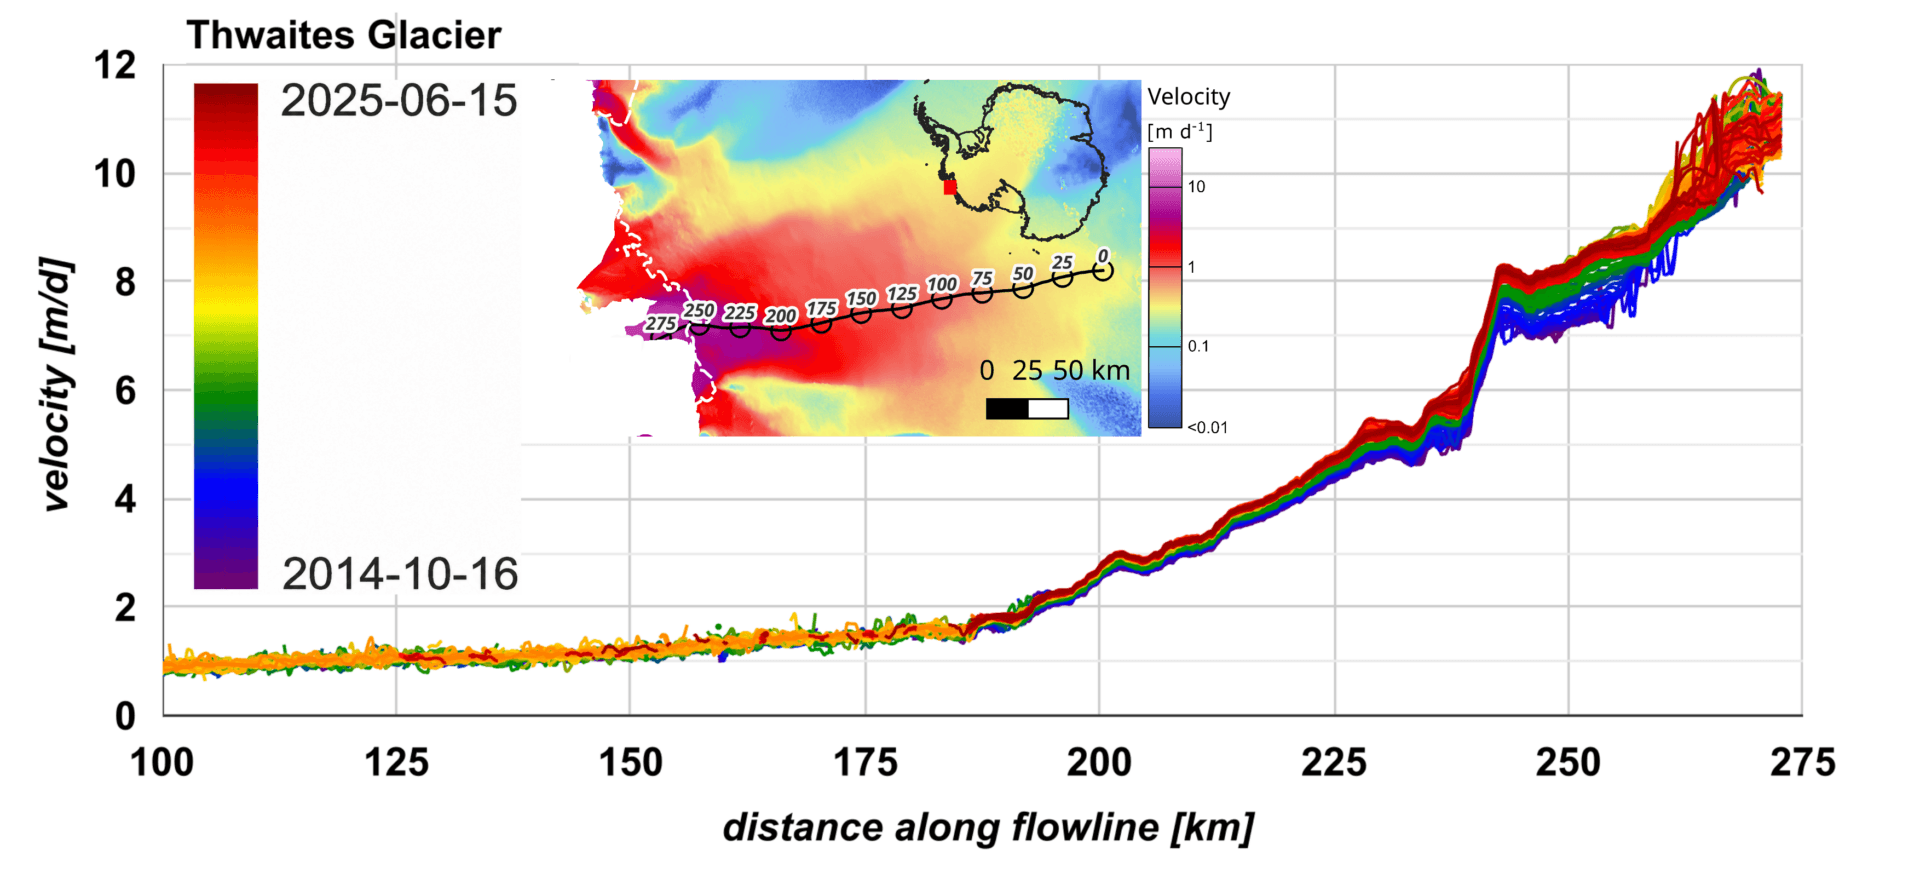
Map of ice velocity of Thwaites Glacier, West Antarctica, and temporal evolution of velocity from 2014 to 2025 along the main flowline. The transition from grounded to floating ice (the grounding zone) is located between km 230 and km 245.
Greenland Surface Velocity and Ice Discharge
The ice velocity map of the Greenland Ice Sheet, derived from Sentinel-1 data, shows the average velocity over the period 2014 to 2024, posted at 250 m. It is a mosaic of individual velocity maps from single satellite tracks over 6-day and 12-day time spans, derived from almost 55,000 Level-1 single-look complex SAR image products. For velocity retrievals the combination of offset tracking and SAR interferometry methods was applied. For fast flowing outlet glaciers offset tracking is used whereas on slowly moving sections in the central parts of the ice sheet the InSAR method offers significant improvements.
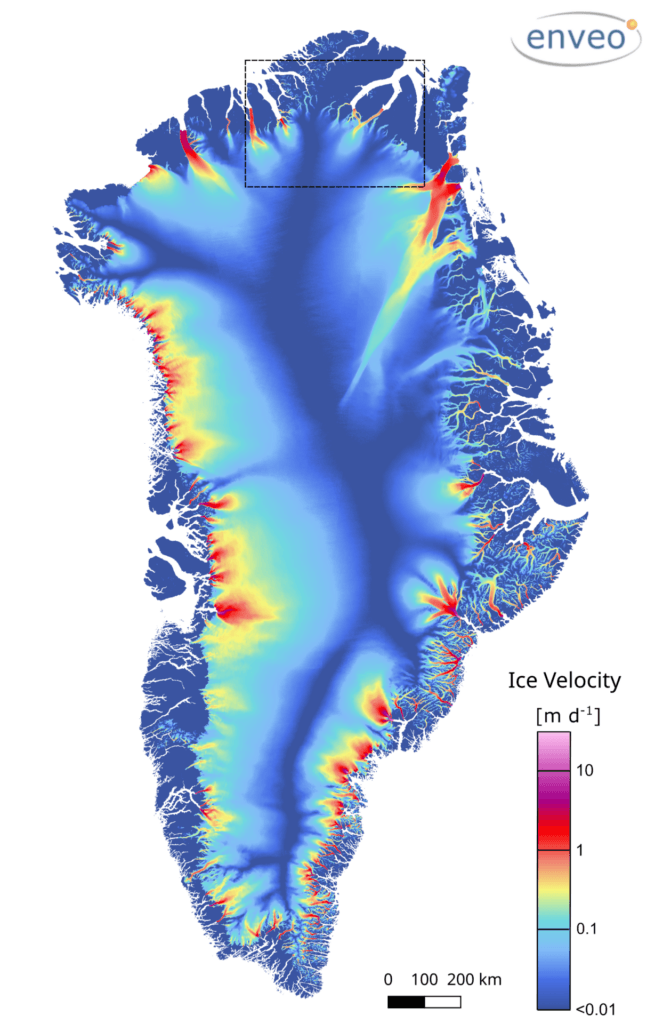
Map of ice velocity of the Greenland Ice Sheet, derived from Sentinel-1 data. The outline encloses the area of the close-up shown in the figure below.
The operational ice velocity monitoring system, operated by ENVEO, is a key data source for generating time series of ice discharge across the grounding line into ice shelves and for calving into the ocean, a main component of the mass balance of polar glaciers and ice streams. During the last decade Greenland’s average losses of ice mass due to surface melt and ice export at outlet glaciers were of the same magnitude. As an example, the figure shows the ice discharge across a flux gate of Academy Glacier in northern Greenland from 2015 to 2025. The monthly mean ice velocities are based on Sentinel-1 data. The ice thickness at the flux gate was measured by an airborne depth-sounding radar. Seasonal as well as multi-annual trends of flow velocity and ice discharge are evident.
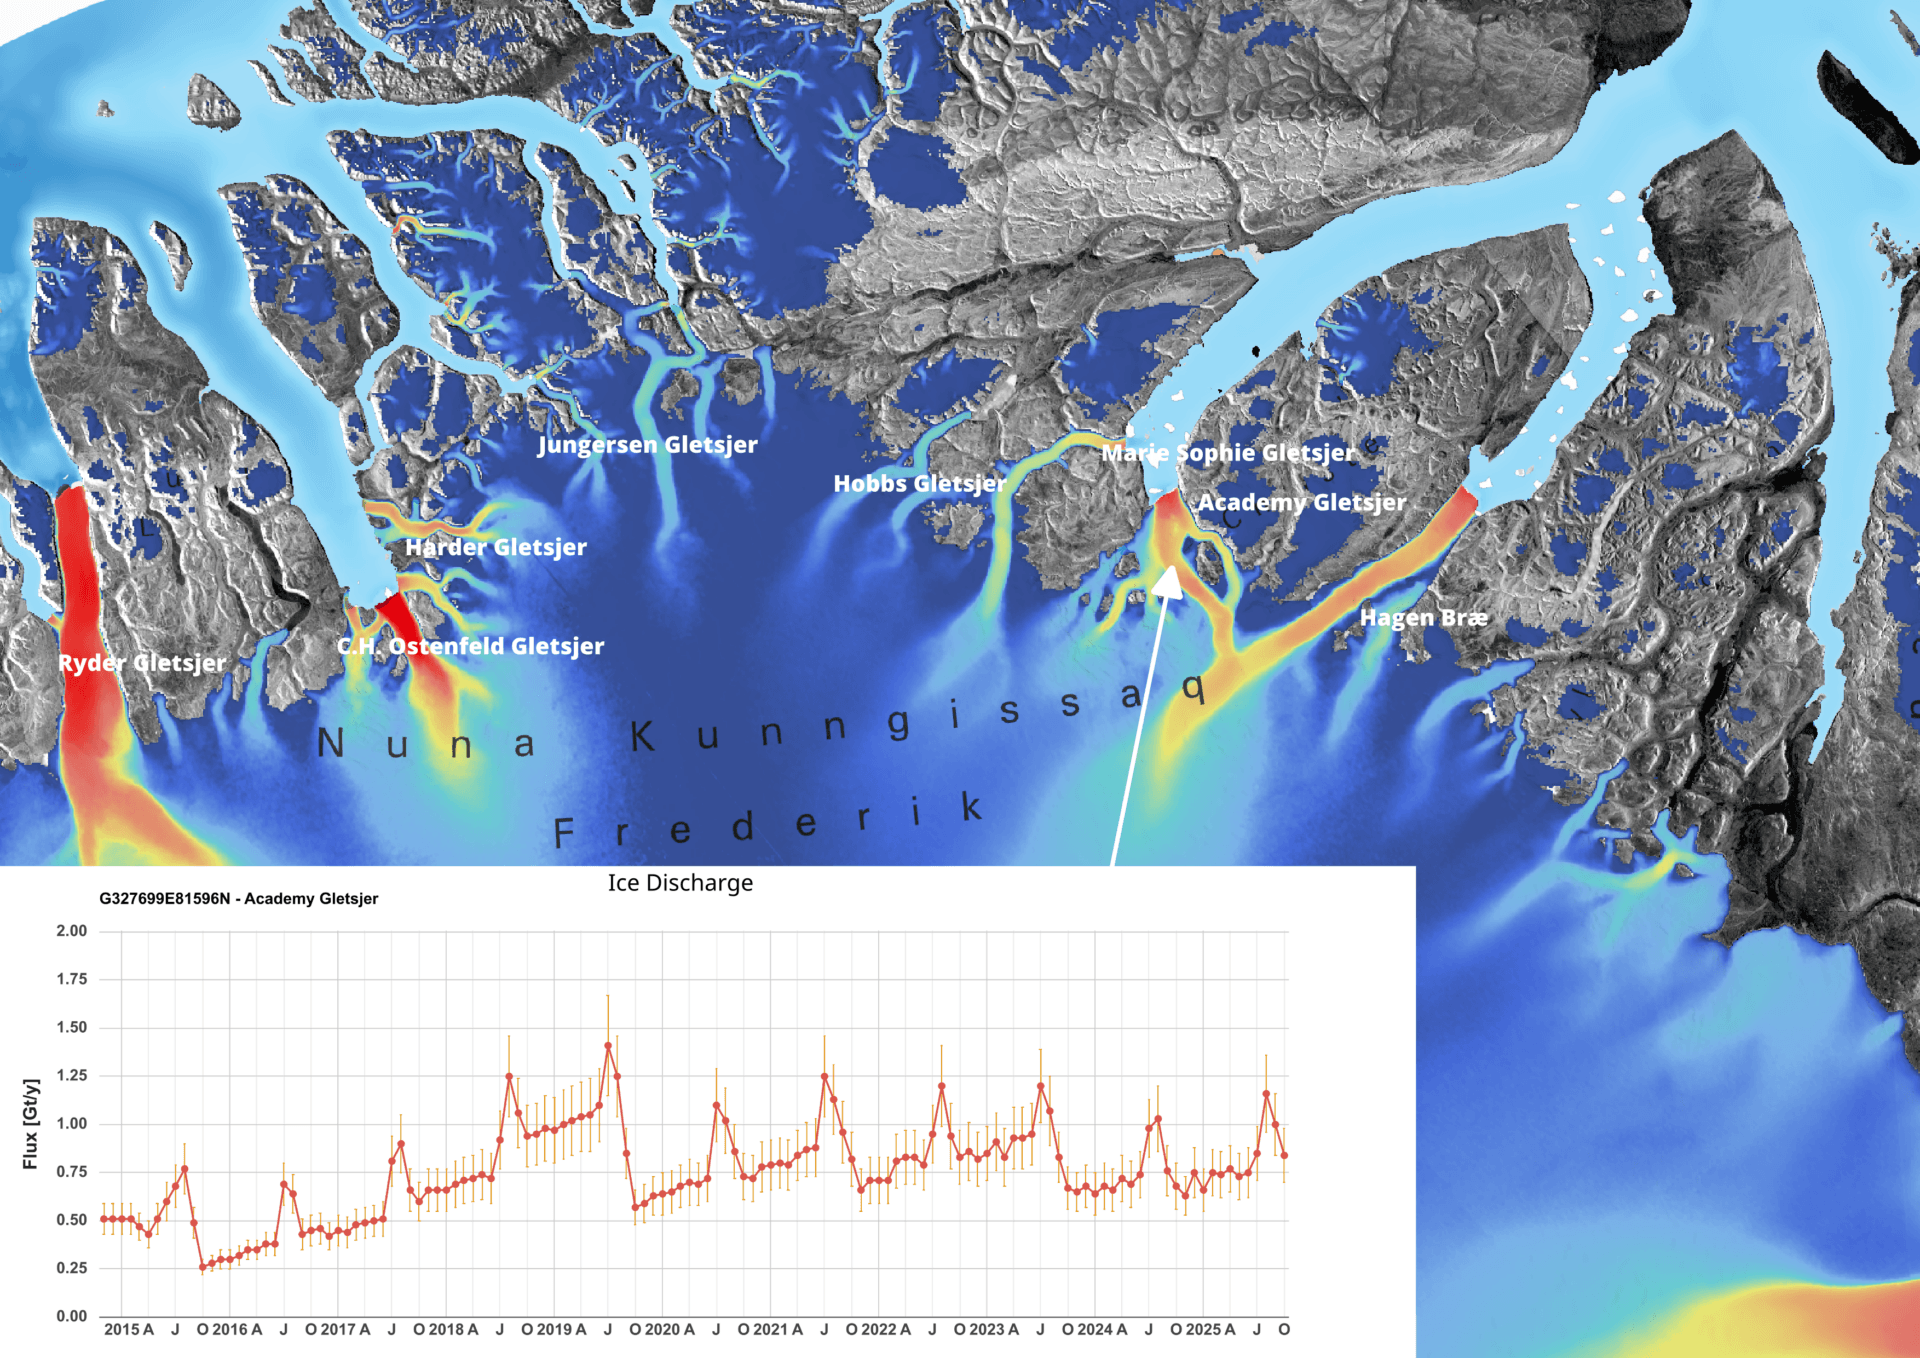
Ice velocity of glaciers in Northern Greenland derived from Sentinel-1 data and ice discharge (Gt/year) from 2015 to 2025 across the grounding line of Academy Glacier based on ice velocity time series and ice thickness data.
Conclusion and Outlook
The activities on ice sheet observations by means of satellite data, reported in this weblog, have been supported by the ESA Climate Change Initiative (CCI), the ESA Polar Science Cluster and the EU Copernicus Climate Change Service (C3S) programs. Since 2025 ENVEO is PI of the C3S Service on Essential Climate Variables for the Land Cryosphere Domain.
ENVEO’s research activities and the generation of satellite-based products over ice sheets include the continuous mapping of ice sheet velocities, the estimation of ice discharge of outlet glaciers and the mapping of surface melt extent and intensity. Currently the main source for ice velocity retrievals are Sentinel-1 data. The ice sheet wide surface melt product is based on METOP scatterometer (ASCAT) data and for regional scale products on Sentinel-1 data. Ongoing methodological development activities at ENVEO, aiming at further improvements of satellite-based ice sheet products, prepare for polar applications of the upcoming Copernicus missions Sentinel-1 Next Generation and Radar Observing System for Europe at L-band (ROSE-L).
Media information
Written by Helmut Rott, Jan Wuite and Thomas Nagler.
Contact: use our contact form.
Layout by the APRI-Media Team.
Images: © ENVEO.
References:
Wuite, J., Nagler, T., Hetzenecker, M., Rott, H.: 2025. Ten years of polar ice velocity mapping using Copernicus Sentinel-1. Remote Sensing of Environment, 332, 115092, https://doi.org/10.1016/j.rse.2025.115092.