Hunga Tonga’s 2022 eruption in the South Pacific Ocean erupted on January 15th 2022. This eruption was unique as it injected unprecedented water vapour into the atmosphere which can still be rewriting the rules of our winter weather.
GOES-17 visible-band snapshot of the Hunga Tonga–Hunga Ha’apai eruption on 15 Jan 2022 (04:30 UTC). The key point: the plume rose unusually high into the stratosphere, helping loft water vapour that can influence climate for years.
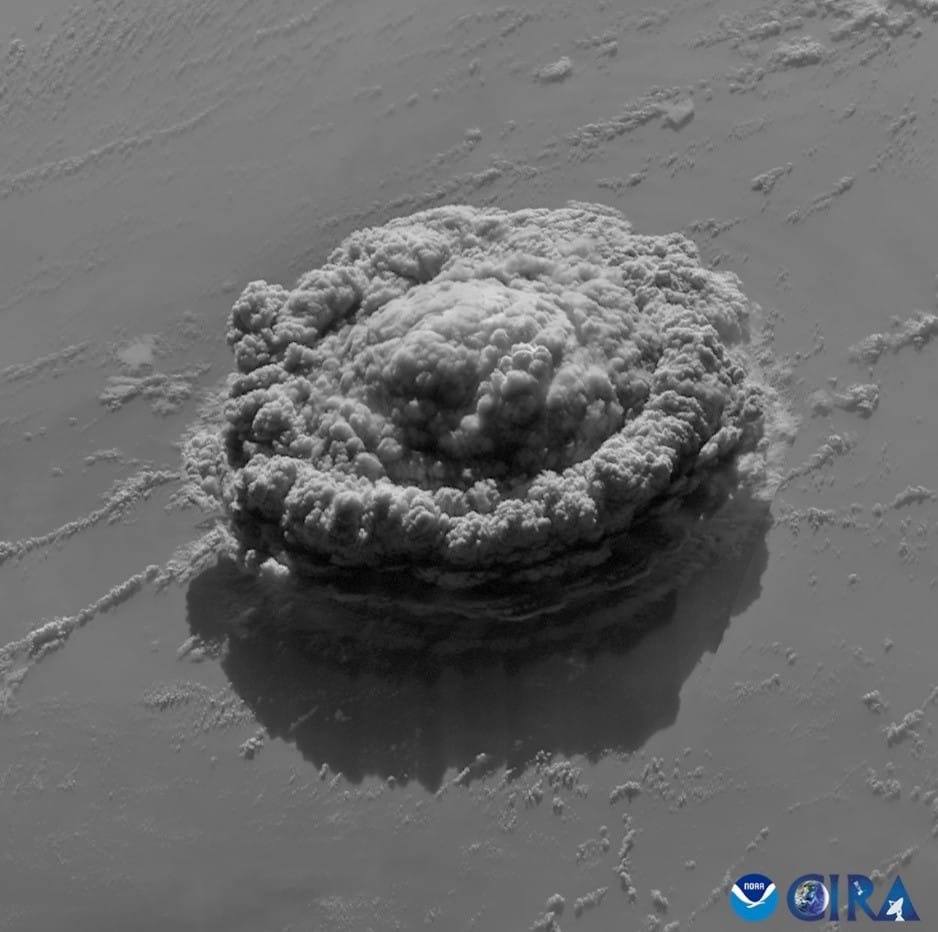
A broad view of Hunga Tonga-Hunga Ha‘apai’s powerful eruption. Timespan Start: 2022/01/15 03:50 – 2022/01/15 05:40
Satellites Himawari-8, Products GeoColor
Background
The polar vortex is a ring of fast winds in about 30 km height. It is alternating between weakening and strengthening phases which modulate the jet stream.

The illustration above shows how the stratospheric polar vortex impacts the surface weather. When the Arctic polar vortex is especially strong and stable (left globe), it affects the polar jet stream lower in the troposphere, to shift northward. The coldest polar air stays in the Arctic. When the vortex weakens, shifts, or splits (right globe), the polar jet stream often becomes extremely wavy, allowing warm air to move into the Arctic and polar air to break into the mid-latitudes.
We want to understand how the massive influx of water vapour caused by the 2022 eruption acts as a multi-year driver of atmospheric fluctuations. By uncovering the links between moisture caused by the undersea eruption and the strength of the polar vortex in the stratosphere, we can better correlate weather anomalies at the surface and improve the predictability of long-term climate models.
The chart below shows the wind speed of the polar vortex in abt. 30 km height (10 hPa) at the northern latitude of 60°N during three post-eruption winters.

Polar-vortex strength represented with one number: zonal (west-to-east) wind at 10 hPa (~30 km) and 60°N. Wind speed is in metres per second (m/s). The grey line and shading show typical winter conditions (climatological mean and variability); coloured lines show individual winters. When the curve drops toward 0 m/s or below, the vortex is disrupted (sudden stratospheric warming).
“In the normally extremely dry stratosphere, the water vapour plume associated with Hunga-Tonga eruption triggered in the South Pacific profound chemical and physical changes, the consequences of which were even noticeable in Europe.”
Ales Kuchar
Not a typical volcanic eruption
Volcanic eruptions traditionally cool the surface by reflecting sunlight through sulfate aerosols. However, the Hunga Tonga (HT) eruption was unique; it released modest amount of sulfur dioxide (0.4 Tg; Tg = teragram = 10¹² g, about one million tonnes) but unprecedented water vapor 140-150 Tg reaching stratospheric and mesopheric altitudes, respectively.
Early research focused on immediate impacts, such as the initial weakening of the Northern polar vortex which can be associated with typical cold anomalies in the northern Europe. The follow-up research paper focuses into the long-term legacy: how this moisture, still descending years later, shifted from weakening to dramatically strengthening the vortex by the winter of 2024/2025. The study explores the radiative cooling effects of water vapor “tongues” that sharpen temperature gradients, effectively making winds in the stratosphere stronger. This line of research establishes novel pathways by which water-rich volcanic eruptions can indirectly impact the surface climate via downward propagation of the dynamical perturbation from the stratosphere and lower mesosphere.
In the 3D graphic below, blue-green highlights where the atmosphere is wetter than in non-eruptive conditions, while brown shows the sulfate-aerosol signal in lower altitudes.

The vertical and latitudinal redistribution of volcanic material matters. 3D snapshot of Hunga Tonga anomalies in the SOCOLv4 Earth System Model. Water vapour is shown as a volume mixing-ratio anomaly in ppmv (parts per million by volume), and sulfate aerosol as a surface area density anomaly in µm²/cm³ (square micrometres of particle surface per cubic centimetre of air). ‘Anomaly’ means the difference from a companion simulation without the eruption (non-eruptive conditions): positive colours indicate more water/aerosol than normal several months after the eruption.
Targeted simulations to reveal causality
We combined satellite data from NASA’s Microwave Limb Sounder (MLS) with reanalysis datasets and Earth system model simulations using SOCOLv4. The model’s ability to simulate interactions between chemistry and aerosol microphysics (as shown schematically below) provide us a powerful tool to study impacts of the Hunga-Tonga eruption.

Schematic of the SOCOLv4 Earth System Model (SOlar Climate Ozone Links, version 4). It couples the ECHAM6 atmospheric circulation model with the MPIOM ocean model (Max Planck Institute Ocean Model), the MEZON atmospheric-chemistry module, and the AER sulfate-aerosol microphysics module. Model levels extend up to ~0.01 hPa (hPa = hectopascal, a pressure unit; ~0.01 hPa corresponds to about 80 km altitude).
To reveal cause and effect, we ran targeted “twin” simulations: one with the eruption’s extra water vapour, and one without it. These experiments show opposing responses. First, extra tropical water vapour can reduce meridional (north-south) temperature contrasts near the stratopause (the top of the stratosphere, around ~50 km), weakening the polar vortex and increasing the odds of sudden stratospheric warmings. Later, as the moisture descends into higher latitudes together with ozone reductions, it can cool the Arctic stratosphere locally—strengthening the pole‑to‑tropics temperature contrast and accelerating the vortex winds. In summary, it matters where the moisture ends up as much as how much was injected.

From cloud to global redistribution of water vapour. 3D visualization of the simulated Hunga Tonga water-vapour plume shortly after the eruption in SOCOLv4. Greyish contours represent water-vapour anomalies from 1 to 3 ppmv ((parts per million by volume) relative to a non-eruptive control run. We neglect aerosol particles for simplicity. The negative and positive modelled two-metre temperature anomalies are visualized with blue and red colours, respectively.
Despite challenges such as somewhat too-fast transport in the model, the simulations capture this ‘dichotomy’: initial weakening followed by intensification in winter 2024/2025.
What Hunga Tonga teaches us
The Hunga Tonga eruption reminded us that a single volcanic event can dictate the rhythm of the stratosphere for several years. While the 2024/2025 winter controlled by the water vapour excess saw an abnormally strong vortex, simulations predicted the pendulum swung back towards odds of sudden stratospheric warmings in 2025/2026 as moisture levels decline.

The water vapour excess declines in time. Water‑vapour anomalies over 60–90°N from September 2024 to November 2025, in ppmv (parts per million by volume) relative to the 2006–2020 mean (a non‑eruptive baseline). +1 ppmv means one extra water‑vapour molecule per million air molecules. Pressure is in hPa (lower pressure = higher altitude). Data are gathered from Microwave Limb Sounder (MLS) instrument onboard NASA’s Aura satellite operational since 2004. Since May 2024 the 190 GHz subsystem in MLS is responsible for observing water vapor has been operating on a duty cycle to extend the instrument’s lifetime. Due to a retrieval artifact in the 10–8 hPa layer we smoothed the data vertically.
We may view such eruptions as intermittent “windows of forecast opportunity” given the location of the water vapour plume.
Why observations matter
Model improvements rely on validation using satellite observations. Better constraining the structure and transport of the descending WV plume using MLS on NASA’s Aura satellite may be problematic due to the “duty cycle” of the 190-GHz observations to conserve remaining life for these measurements. Its decommissioning will cause a substantial gap in the measurement of critical atmospheric components such as water vapour and poses significant challenges for continuous monitoring and assessment of the effects of future extreme events including volcanic eruptions (Salawitch et al, 2025).
Media information
Layout by the APRI-Media Team.
Contact: use our contact form.
About the scientific author
Aleš Kuchař, BOKU University, Vienna, Austria
Follow him on LinkedIn.
Access to original papers:
https://doi.org/10.5194/acp-25-3623-2025
https://doi.org/10.5194/egusphere-2026-406
I acknowledge all scientists involved in this research across several European institutions (BOKU in Wien, Wegener Center in Graz, PMOD in Davos, Instituto de Geociencias in Madrid, University of Bern) and external data providers.